 Dune’s dashboards make it easy to visualize market share and trends across DeFi and perpetuals platforms.
Dune Analytics: Free Market Intelligence for Small Crypto Investors
Why Every Crypto Investor Needs Market Data
In my experience helping individual investors and small funds navigate crypto markets, I’ve found that access to quality market data makes the difference between profitable investing and expensive guessing.
Professional traders pay thousands monthly for Bloomberg terminals and specialized crypto analytics. Meanwhile, individual investors and small businesses are stuck with basic price charts and generic market summaries.
Dune Analytics changes this dynamic by providing institutional-grade blockchain analytics for free, giving small investors the same data advantages as well-funded trading firms.
The Small Investor’s Data Problem
The Challenge:
- Professional analytics platforms cost $500-5000/month
- Free tools show only surface-level price data
- Market-moving trends are buried in complex blockchain data
- By the time trends hit mainstream news, the opportunity is gone
- Small investors make decisions with incomplete information
What You Actually Need:
- Early trend identification before mainstream adoption
- Understanding of where institutional money is flowing
- Real protocol usage data, not just marketing hype
- Market share analysis across competing platforms
How Dune Levels the Playing Field
Free Professional-Grade Analytics:
- Access to the same blockchain data that institutional analysts use
- Pre-built dashboards by top crypto researchers and analysts
- Real-time market share, volume, and user activity data
- No coding required - just explore existing dashboards
Real-World Example: Perpetuals & DeFi Analytics
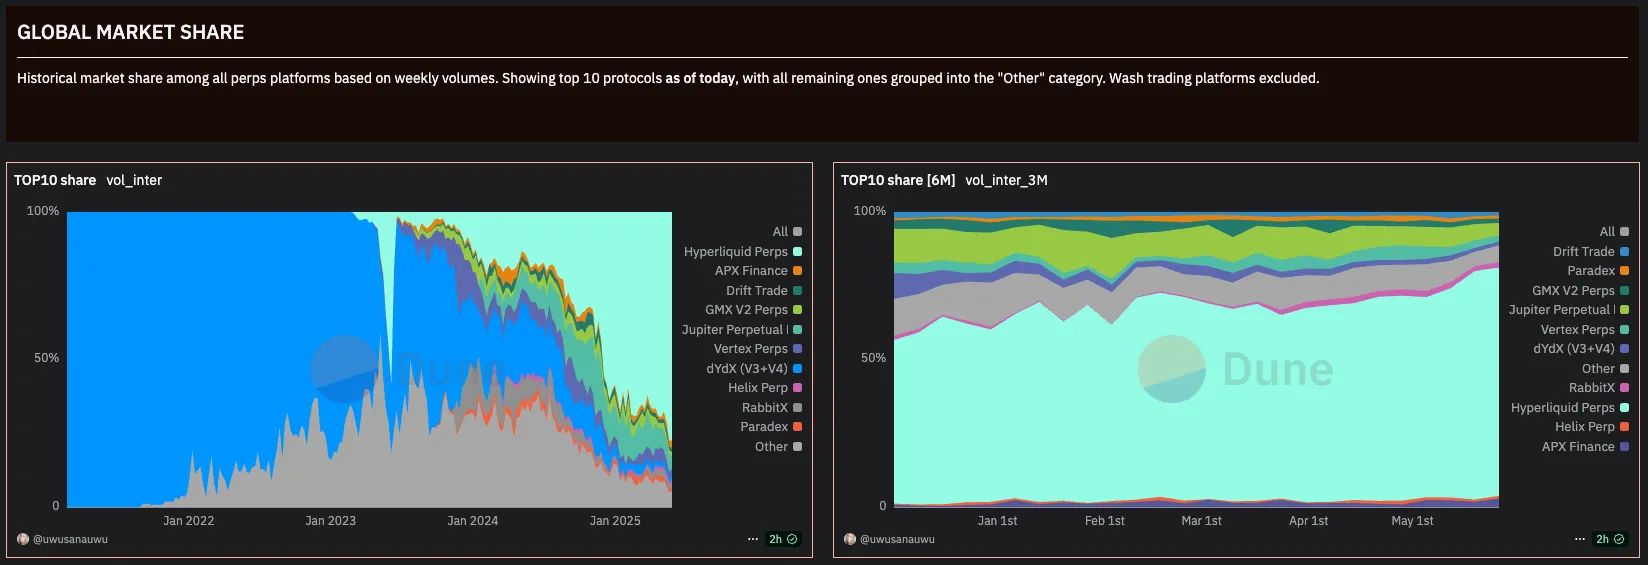
One of my favorite dashboards is the Perps Market Share & Analytics by @uwusanauwu. It tracks everything from protocol dominance to trading volumes and TVL, all in real time.
Market Share: Who’s Winning the Perps Race?
See how the top perpetuals protocols stack up over time. Dune makes it easy to spot shifts in dominance and new trends as they happen.
Volume: Tracking the Pulse of the Market
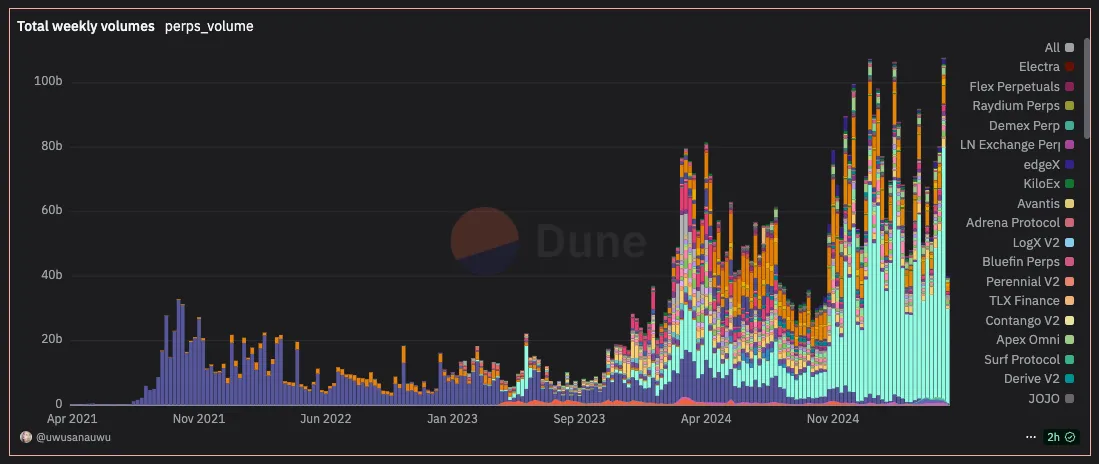 Weekly volume charts show when activity spikes, which protocols are gaining traction, and how the market evolves.
TVL, Revenue, and Dominance: The Full Picture
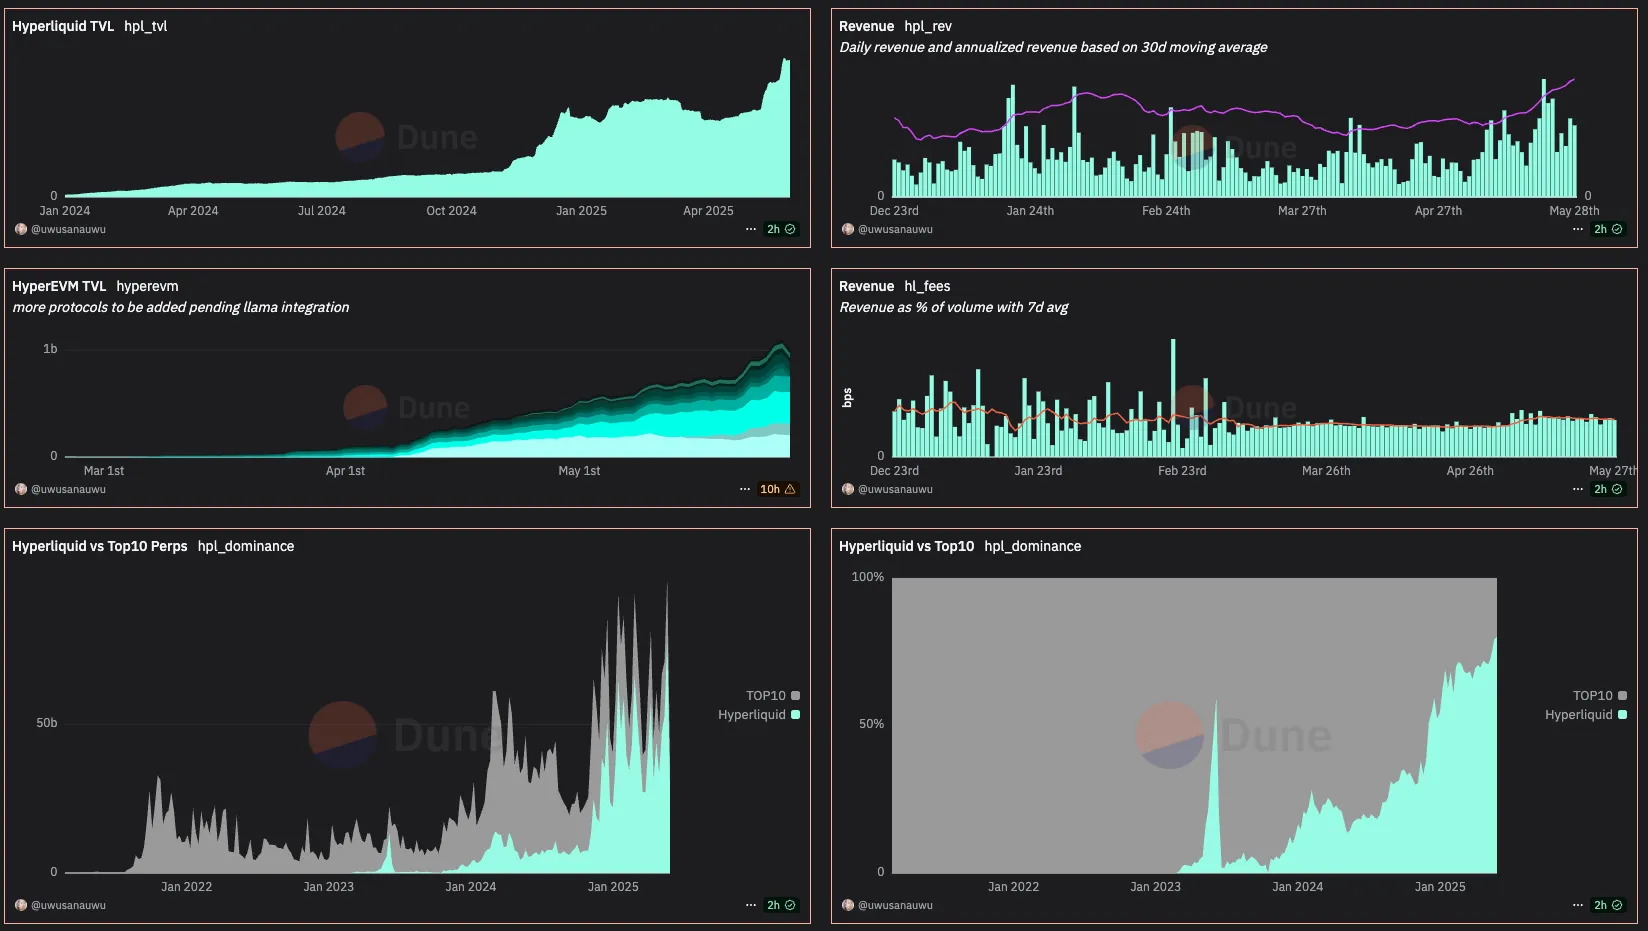 Dune lets you track TVL growth, protocol revenue, fee structures, and dominance—all in one place.
How Dune Helps Me Trade Smarter
With Dune, I can:
- Compare protocol growth and market share at a glance
- Spot new trends before they hit mainstream dashboards
- Dive deep into revenue, fees, and user activity
- Remix or build my own dashboards for custom insights
Key Takeaways
- Dune is the go-to platform for on-chain analytics and DeFi research
- Community dashboards make advanced analytics accessible to everyone
- Visualizations help you see the big picture and act fast
- Explore the Perps Dashboard to see it in action
Try It Yourself!
Curious about what’s happening on-chain? Dive into Dune, explore dashboards, and start building your own insights. The data is out there—Dune just makes it easy (and fun) to use.