Markets in the Shadow of War: A Snapshot of the Barbell World
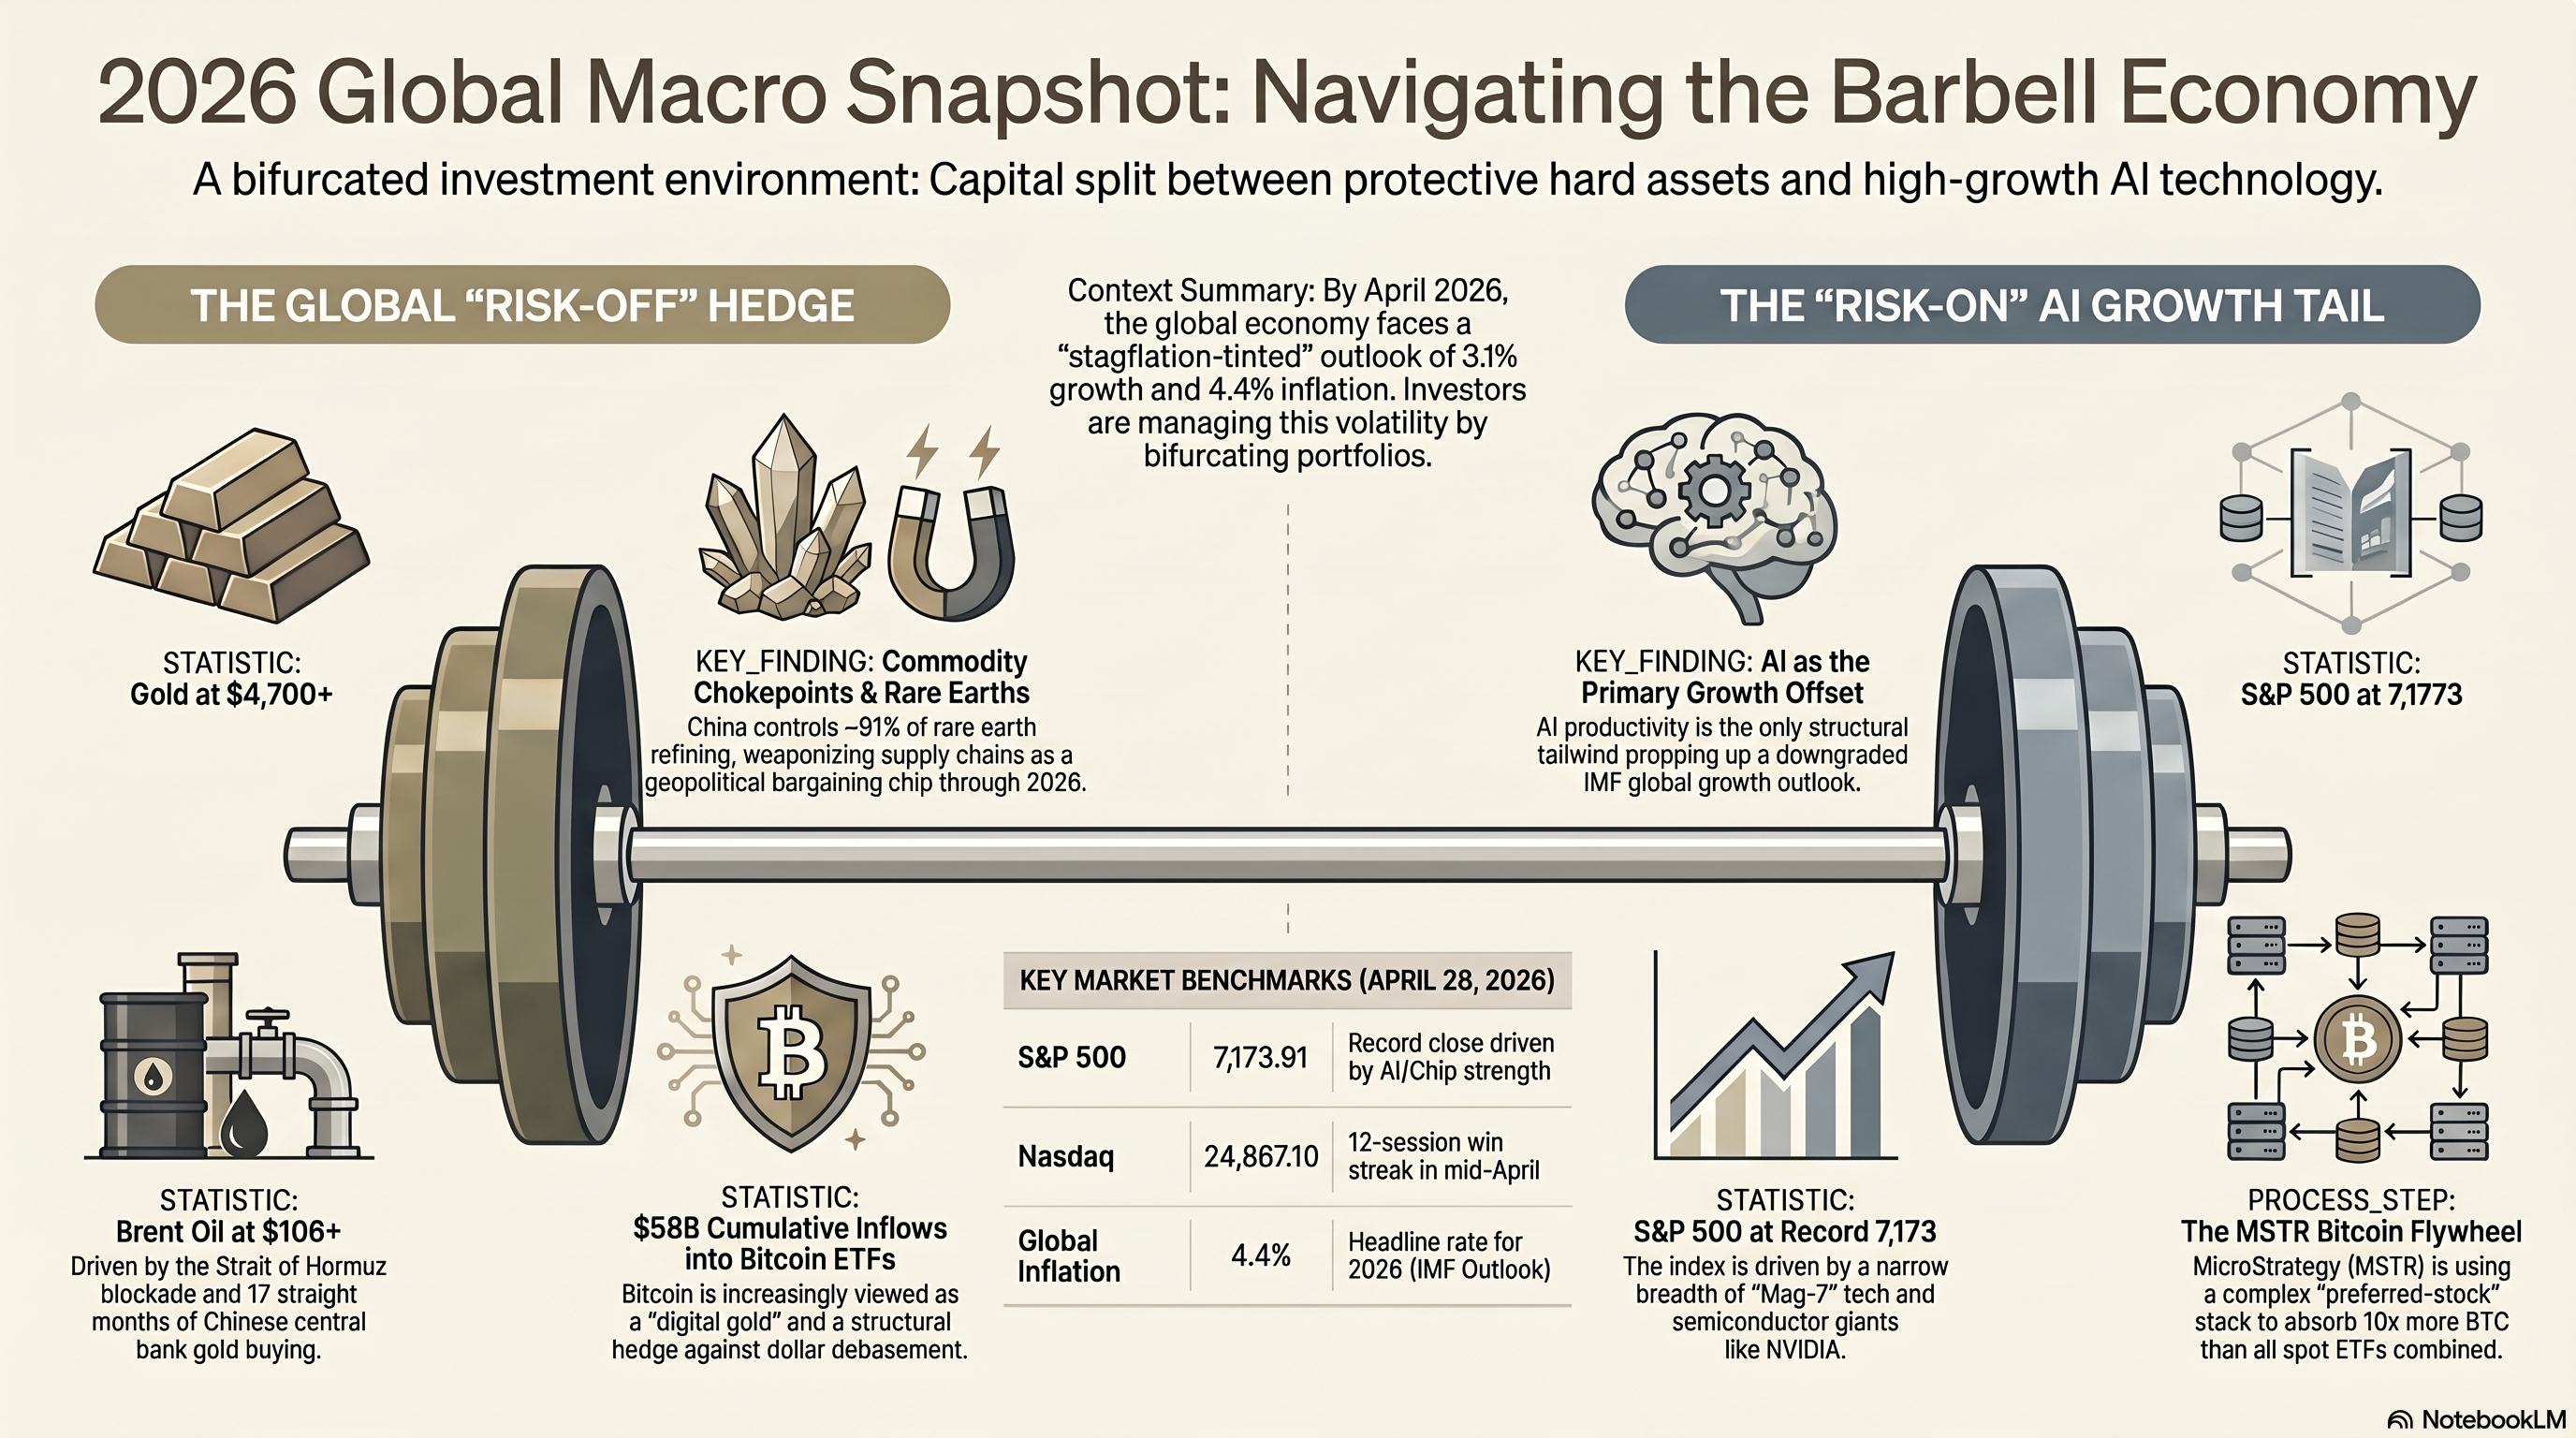
The S&P 500 closed at 7,173 on April 27. The Nasdaq hit 24,887. Both records. On the same day, Brent crude pushed past $107 a barrel, gold sat near $4,700, and the Strait of Hormuz — through which roughly a quarter of seaborne oil normally moves — has been functionally closed for two months. The US and Israel are at war with Iran. Russia and Ukraine have just begun a fifth year of grinding combat. China’s central bank is on its 17th consecutive month of net gold purchases.
It is tempting to call this a divergence and move on. But the tapes are not actually telling different stories — they are telling the same story, refracted through different asset classes. The story is that the world is in the middle of a regime shift, and capital is positioning at both ends of a barbell while the middle gets squeezed. The IMF’s April outlook, titled Global Economy in the Shadow of War, downgraded global growth to 3.1% and revised inflation up to 4.4% — a stagflation-adjacent base case in which the Federal Reserve has, in its own staff’s words, “little room to cut.” That is the macro backbone. Everything else is a refraction of it.
This is a narrative pass through the live themes — what is being priced, why it might be right, and what would tell us it is wrong.
The Two Tapes
The simplest way to read late-April 2026 markets is as two tapes running simultaneously.
The first tape is risk-on. US large-cap tech is at record highs, with the Nasdaq posting a 12-session win streak in mid-April — its longest since 2009. NVIDIA trades around $199, with TSMC reportedly producing two million H200 chips for 2026 alone. Bitcoin has recovered from a $70,000 early-April low to push back toward $80,000, and US spot Bitcoin ETFs have absorbed more than $58 billion in cumulative inflows since launch, with assets under management north of $102 billion. Spot Ethereum ETFs, increasingly with staking attached, are pulling in steady institutional flow.
The second tape is risk-off. Brent and WTI sit in the triple digits with no clear off-ramp. Gold has traded in the $4,000–$6,300 range that major desks now consider plausible for 2026, and central banks added 1,200 tonnes in 2025 alone. Critical minerals — rare earths, tungsten, antimony — have seen prices spike up to sixfold outside China after Beijing tightened export controls in two waves through 2025 and early 2026. Insurance rates on Strait shipping are punitive when shipping is available at all.
These tapes are not contradictory. They are the natural expression of a world where two things are simultaneously true: AI-driven productivity is the dominant idiosyncratic growth story, and the post-1991 unipolar order is no longer the operating assumption beneath asset prices. The first thesis bids tech and any asset that benefits from financial-system flexibility, including digital assets. The second thesis bids hard assets and anything that hedges the unwinding of that order. Capital that reads both correctly ends up at both ends of the barbell. Capital that splits the difference — long-duration sovereigns at sub-inflation yields, rate-sensitive cyclicals exposed to oil passthrough, EM commodity importers with dollar-denominated debt — gets squeezed.
The Real-Asset Bid
The clearest signal that we are in a regime shift is the behavior of central banks themselves. Gold is not an inflation hedge in the textbook sense; over short horizons its correlation with CPI is unreliable. What gold does reliably hedge is the credibility of the issuer of the alternative — historically, the US dollar and US Treasuries. When the People’s Bank of China extends a buying streak past 17 months and central banks collectively absorb over a thousand tonnes a year, they are not making a tactical bet on next quarter’s CPI. They are repricing counterparty risk on the reserve asset.
The mechanics of why are straightforward. The 2022 sanctions regime against Russia demonstrated that dollar-denominated reserves are political. For any non-aligned sovereign, that is now a risk to be managed, not a hypothetical. Gold has no counterparty risk and no payment-rails dependency. Bitcoin has the second property and a partial version of the first. Both are getting bid by the same logic, even though the buyers are different — pension funds and family offices for one, sovereigns and central banks for the other.
The same logic operates in critical minerals, only weaponized in the other direction. China controls roughly 60% of rare-earth mining and approximately 91% of refining, plus dominant shares of tungsten and antimony. The 2025–2026 export controls, which expanded the restricted list to twelve elements and added “parts, components, and assemblies” language, mean that any Western firm more than three intermediaries away from a Chinese REE producer — which is most of European industry — can have its supply chain interrupted at Beijing’s discretion. The implications run downstream into autos, defense, aerospace, semiconductors, and AI data center construction. The market response — Western producers like MP Materials and Lynas getting strategic re-rating attention, energy and defense majors becoming structural longs, and the entire concept of “friend-shoring” gaining policy traction in Washington and Brussels — is rational.
What would invalidate the real-asset bid? Three things, ideally in combination. First, a durable Iran resolution that reopens Hormuz with credible long-term safety guarantees, taking the geopolitical premium out of oil. Second, the PBoC pausing or reversing gold purchases — which would imply a meaningful detente between Washington and Beijing on the underlying reserve-credibility question. Third, evidence that Western critical-minerals capacity is genuinely scaling, which would defuse the chokepoint thesis. None of these look likely on a six-month horizon, but they are the variables to watch.
The Digital Asset Re-Rating
The bull case for digital assets in this cycle is not narrative-driven in the way prior cycles were. It is structural. The case is that the institutional plumbing for owning Bitcoin and Ethereum, in size, with full compliance and audit comfort, is now built. ETFs are the visible part of that. The mechanism that has emerged around Strategy (formerly MicroStrategy) is the less-discussed but arguably more important part.
Strategy now holds 780,897 BTC, acquired for roughly $59 billion at an average cost basis around $75,577. What is novel is not the size of the holdings but the capital structure underneath them. Strategy operates a four-tranche perpetual preferred stack — STRK, STRF, STRD, and STRC — each engineered for a different income-investor profile. STRC, the most recently introduced, is a perpetual paying an 11% annual dividend and designed to trade near its $100 par value. Strategy issues STRC into the market when conditions are favorable, converts the proceeds to Bitcoin, and the cycle repeats.
The numbers are striking. Year-to-date in 2026, STRC alone has funded approximately 77,000 BTC of purchases. That is roughly ten times the net Bitcoin accumulation of all US spot Bitcoin ETFs combined over the same period. Bitwise has projected that US-listed Bitcoin ETFs alone could buy more than 100% of new 2026 issuance — and that projection does not include Strategy’s preferred-stack absorption.
The reason this matters is that it changes the buyer base. Spot ETFs route equity-style capital — RIAs, family offices, pension allocators — into Bitcoin. Strategy’s preferred stack routes fixed-income capital — insurance general accounts, income-focused funds, retail yield seekers — into Bitcoin. These are pools of capital that, structurally, would never own BTC directly. They own STRC because it pays 11% and trades near par, and the fact that the proceeds end up buying Bitcoin is, from their seat, an implementation detail.
Reflexivity is the obvious feature and the obvious risk. Higher Bitcoin lifts MSTR, which improves the cost of preferred issuance, which funds more accumulation, which supports Bitcoin. The mechanism works in the other direction with equal force. The honest question for an investor is how the preferred stack performs in a multi-year drawdown — how dividend coverage holds up if BTC enters a 50% bear market, how investors react if STRC trades materially below par for an extended period, and what happens to the marginal-buyer thesis if the model is seen to be stressed. There is no clean answer to those questions yet because the model has not been tested in that regime.
Ethereum is undergoing a parallel, quieter institutional turn. Spot ETH ETFs added $539 million of inflows in April. More significantly, staking-integrated ETFs — Grayscale’s ETHE since October 2025, BlackRock’s ETHB since March 2026, with Fidelity, Franklin Templeton, Invesco, 21Shares, and VanEck pending Q2 approval — now account for north of 40% of institutional ETH exposure. The staking ratio has reached 32%, with 3.4 million ETH backed up in a 60-day validator queue. The thesis embedded here is that ETH becomes the yield-bearing crypto reserve asset — a sort of digital fixed-income instrument with optional upside, anchored to whatever AI and data-availability demand catalysts unfold over the next cycle.
Validation for the digital asset re-rating looks like continued ETF accumulation, the MSTR preferred mechanism holding through at least a moderate drawdown, and the first credible sovereign disclosure of Bitcoin holdings. Invalidation looks like sustained ETF net outflows for a quarter or more, the preferred stack visibly stressed during a Bitcoin correction, or a regulatory shock — a recategorization of staking ETFs, an unfavorable tax ruling, or a major SAB-121-style accounting reversal — that disrupts the institutional plumbing.
AI as the Productivity Tailwind
The IMF outlook is unusually direct about one variable: AI is the only meaningful growth offset in an otherwise downgraded picture. Hyperscaler capital expenditure continues to scale, NVIDIA’s order book is reportedly two million H200-class chips for 2026 alone, and the productivity case has moved beyond hype into the early innings of measurable adoption.
The geopolitical layer underneath is what makes this thematic rather than just a stock pick. The Trump administration dropped the most sweeping draft AI chip export licensing rule in early 2026, which removed a near-term constraint on NVIDIA’s international sales. China-specific controls remain in place, however, and NVIDIA has yet to actually sell its US-approved China-spec H200s into the Chinese market — partly because of buyer caution, partly because Huawei’s Ascend line and SMIC’s domestic capacity have advanced faster than expected. The controls floated in early 2026 around “AI distillation” — restricting the use of frontier-model outputs to train Chinese models — represent a policy attempt to extend the technology lead, but their enforceability is unclear.
The result is a bifurcating AI economy. The US and aligned-AI markets are scaling on hyperscaler demand. China is building a parallel domestic stack with state backing. Sovereign AI is emerging as a category in the UAE, Saudi Arabia, Singapore, and India, each with policy goals around capacity and data sovereignty. Power infrastructure — grid, nuclear, peaker capacity — is becoming the binding constraint in multiple geographies, and energy equities are increasingly cross-correlated with AI capex.
The validation for the AI thesis is straightforward to track: hyperscaler free cash flow has to start showing accretion from AI capex, total factor productivity statistics need to inflect, and adoption metrics need to keep moving. The invalidation is equally straightforward and is the bear case most underwritten by current valuations: a digestion period in which capex outruns measurable returns, leading to the kind of multiple compression that typically follows an over-built infrastructure cycle. The history of railroads, telecom in 2000, and crypto infrastructure in 2018 all rhyme; the question is whether AI’s productivity contribution arrives fast enough to validate the spend before the digestion phase begins.
The Multi-Polar Plumbing
The slow story underneath the loud one is that an alternative financial plumbing is being built and used. mBridge, the central-bank digital currency cross-border settlement platform connecting China, Hong Kong, Thailand, and the UAE, has processed roughly $55 billion in payments, with about 95% denominated in digital yuan. The Bank for International Settlements formally withdrew from the project in 2024, and it has continued operating independently since. India, as 2026 BRICS chair, has put an expanded “BRICS Bridge” interoperability framework on the summit agenda.
The substance is more modest than the headlines often imply. The idea of a unified BRICS currency has been explicitly shelved by the bloc itself. What is happening is a quieter, less-glamorous shift toward bilateral settlement in local currencies. Indian refiners now settle Russian crude in Chinese yuan and UAE dirhams, not because there is a grand de-dollarization agreement but because doing so reduces sanctions exposure and transaction costs. The dollar’s share of global FX reserves has been chipped at the margin, not displaced. But the trajectory is one-directional, and the infrastructure being built — payment rails, settlement systems, custody arrangements — is the durable change.
The Russia-Ukraine war, now in its fifth year, has become the laboratory for what twenty-first-century industrial-scale conflict actually looks like. The Russian rate of advance has halved over the past three months to about 5.5 square kilometers per day. Ukraine intercepted 92% of Russian drones in March 2026, the heaviest month of attacks in the war. Ukrainian sea-drone and long-range strike campaigns have damaged or destroyed roughly 20% of Russia’s refining capacity since early 2024 — a significant input to the global product-market tightness that compounds the Iran shock. Ground robotics are starting to deploy on the Ukrainian side as a response to drone saturation, the Russian advance has stalled, and Zelenskyy has called the front-line situation the best in ten months.
The implication for investors is not the war’s outcome — which remains highly uncertain — but the way it reshapes defense doctrine and procurement. Long-cycle defense contractors with exposure to drones, electronic warfare, ammunition, and air defense are in a multi-year tailwind that is unlikely to reverse regardless of how the specific conflict ends. The procurement decisions being made in 2026 will dictate cash flows through 2030.
The validation for the multi-polar thesis is incremental: mBridge volumes continuing to grow, more bilateral non-dollar settlements appearing in trade data, BRICS membership expanding without fracturing, and continued central-bank gold accumulation. The invalidation requires a major reversal: a US-Iran resolution that materially restores dollar primacy in oil markets, a cooling of US-China tensions sufficient to make critical-minerals weaponization less likely, or a Chinese consumer crisis severe enough to force Beijing inward and slow the outbound-infrastructure agenda.
What Could Break the Tape
Both tails of the barbell have fat scenarios that are not currently priced.
On the bearish side: a fully closed Hormuz for thirty days or more would push Brent toward $150 and tip multiple economies into recession, with second-order effects through emerging-market debt service and European industrial production. A China move on Taiwan while US attention is concentrated on Iran is the geopolitical tail that markets least like to discuss and price. An AI capex digestion period that lasts even one or two quarters would be enough to compress mega-cap multiples meaningfully, given how concentrated index returns have become.
On the bullish side: a credible Iran ceasefire would produce a sharp relief rally in cyclicals and rate-sensitive sectors, and a brutal mean-reversion in defense and energy. A faster-than-expected resolution to the Russia-Ukraine war — most likely through a frozen-conflict outcome rather than a settled peace — would relieve grain, fertilizer, and energy markets simultaneously. AI productivity translating into measurable corporate-level cash-flow accretion within two to three quarters would extend and broaden the equity rally rather than compress it.
The honest position is that none of these scenarios is more than directionally probable. The discipline is to know what one would have to see to act on each.
The Position the World Is Putting On
The barbell is not a clever framing imposed from outside. It is what the actual flows show. Gold is being accumulated by central banks at the fastest pace in decades. Bitcoin spot ETFs are pulling in capital that did not previously exist as Bitcoin demand. AI mega-caps are absorbing the marginal equity dollar. Defense and energy are being structurally re-rated. And the middle — long-duration sovereigns at uncompetitive yields, low-margin consumer cyclicals exposed to passthrough inflation, EM importers with dollar debt — is what is being sold.
Whether the barbell holds is a question of whether the underlying regime persists. As long as the macro environment is one in which growth is structurally slower, inflation is sticky, and the post-1991 international order is being renegotiated in real time, the barbell remains the rational expression of the world as it is. The point of writing it down, with explicit validations and invalidations, is not to predict but to know what one would have to see to change one’s mind.
The IMF’s title is the right framing. We are in markets in the shadow of war — and the markets are pricing it more honestly than the headlines suggest.